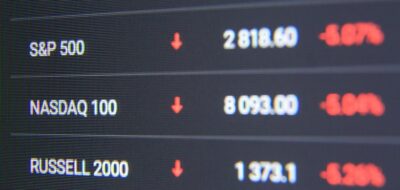
اخبار شاخصها
شاخصها ابزاری عالی برای پوشش ریسک هستند، زیرا حاوی اوراق بهادار مختلف هستند که باعث پخش شدن ریسک در سراسر شاخص میشود. اینجا مرکز خبری شما برای شاخصها، ازجمله S&P، FTSE، Nikkei، NASDAQ و بسیاری موارد دیگر است.
«اخبار شاخصها» ازسوی آموزشگر معاملات ممتاز، LearnFX پشتیبانی میشود.

اخبار شاخصها
The Nasdaq index sheds 300 points (-2.5%) as market bears take the reigns
A quick look at yesterday: the Nasdaq ended the session around the 11,500 level today, after Friday's 300 points decline and close at 11,800. ...
22 February, 2023

اخبار شاخصها
HANG SENG INDEX has shed 0.51% as US yields rally across the board
Yesterday at a glance: HANG SENG INDEX slumps 0.51% to close at 20,424 yesterday. The US yield curve struggled to maintain its balance as ...
22 February, 2023

اخبار شاخصها
The FTSE dives below key support at 7,919.62
Price action breaks below important support level at 7,919.62 Medium-term trend indication turns negative after MACD index generates a crossover sell signal While on ...
22 February, 2023

اخبار شاخصها
Intraday Tech Focus | Downbeat the DAX on course to explore further downside
The DAX's upper Bollinger Band® is at 15,638 which indicates a further downward move may follow. While trading sideways for 8 days, Today's session ...
22 February, 2023

اخبار شاخصها
Bearish session for the Kospi Composite Index insufficient to test key support at 2,416.21
Nearest support line of 2,416.21 is only 1.47 points away Falling prices have precipitated the Kospi Composite Index's approach to its lower Bollinger Band® ...
22 February, 2023

اخبار شاخصها
Bearish the STOXX Europe 50 Index dips below key support at 4,218.62 but bounces back 1.67 points later in the session
Despite dipping below 4,218.62 as support, market bulls are still in control The STOXX Europe 50 Index looks below 4,247.4 (10 day Simple Moving ...
22 February, 2023

اخبار شاخصها
After the Bell Technical Review | Downbeat price action pushes CAC 40 to explore further downside
Medium-term trend indication turns negative after MACD index generates a crossover sell signal CAC 40's upper Bollinger Band® is at 7,383.7 which indicates a ...
22 February, 2023

اخبار شاخصها
Discover the most volatile indices from yesterday's muted session
The Nasdaq is yesterday's top mover after declining 2.5% Today's muted price action is occurring amid mixed market indicators – United States Existing Home ...
22 February, 2023


