ETH is now trading at $1,906 after tracing out a steady $1,892.47 – $1,921.19 range today.
Trend analysis indicates that Ethereum made an initial breakout above its 10 day Simple Moving Average at $1,905.33, a potential indicator of a newly emerging bullish phase. Analysis based on the asset volatility indicates that Ether's upper Bollinger Band® is at $1,965.54, suggesting that a downward move may follow. Ethereum chart analysis: Ethereum is approaching key support, around $59 away from $1,847. Dipping below could indicate further losses are ahead while a failure to break below this level is likely to be seen positively by market bulls.
All in all, the technical analysis suggests Ethereum has no clear-cut direction.
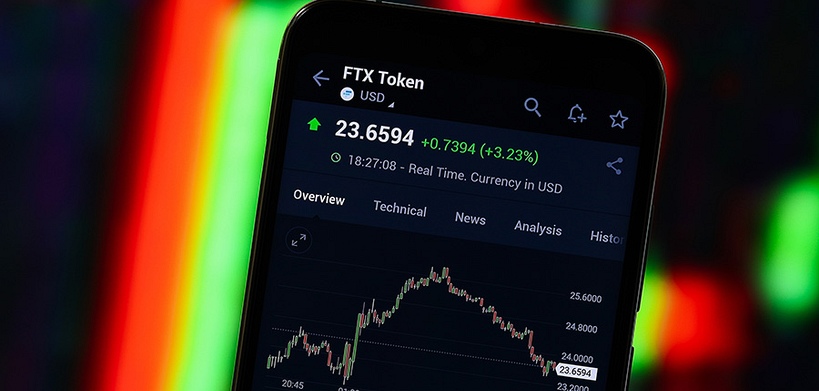
At the same time, mixed performances are seen elsewhere as FTX Token added 9.54% to its value, now trading at $1.36. UNICORN Token USD slips 2.98% to trade around $6.43.
This year has been a bright one for Ether after trading as low as $993.77 and going on to appreciate by 58.73% year to date. Ethereum is currently trading with a market cap of 229.37 billion with an average daily volume of 9.15 billion.

 |
|  May 07, 2023


