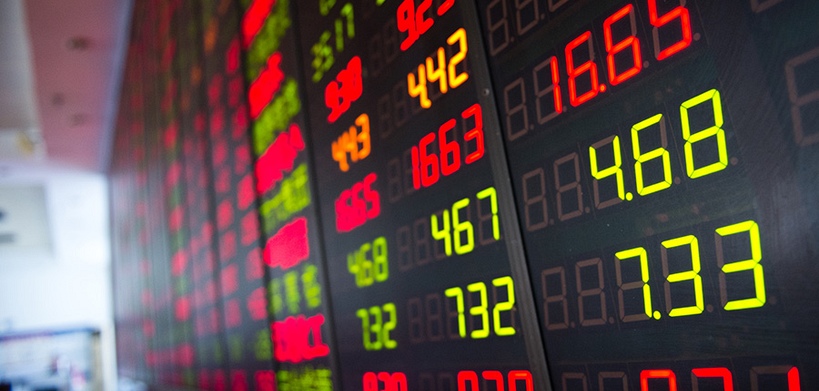
Today at a glance: ASX recovered back to 7,255.7 after dipping down to 7,236.2, in a session that followed yesterday's 7,264 close value.
Uncertainty around ASX is reflected by published market data as new Retail Sales data from Australia matched market expectations with a reading of 0.4% — a positive step in contrast to previous data of 0.2% from last month.
A study of ASX's chart reveals various key levels to watch: ASX 200 is oscillating around the 7,244 level serving as support. With regards to technical trend indicators, chart analysis show that ASX made an initial break below its 5 day Simple Moving Average at 7,228, a possible indication of a forthcoming negative trend. Price action remains constrained around the key Fibonacci level of 7,245 currently serving as support. If price action breaks below, the next Fib hurdle is 7,213. Asset volatility analysis shows that ASX's upper Bollinger Band® is at 7,412.32 and the lower is 7,189.
Overall, while ASX has been on an uptrend, technical indicators suggest that it has no obvious direction for the immediate future.
While ASX was pretty flat today, mixed performances were seen elsewhere as Dow Jones is down to 33,341, losing 220.89 points, after ending the previous session around 33,562. After ending today's session at 2,510, KOSPI Composite Index lost 13.49 points and is trading around 2,496.51. Hang Seng withdraws 0.53% today and closed at 19,868.
Data to be released tomorrow might clear up some of the market fog as Australia Westpac Consumer Sentiment (May) scheduled to come out tomorrow at 01:30 UTC.
Trading mostly sideways for a month. ASX reached a significant high of 7,558 around 3 months ago but has lost 3.89% since then.

 |
|  May 10, 2023


