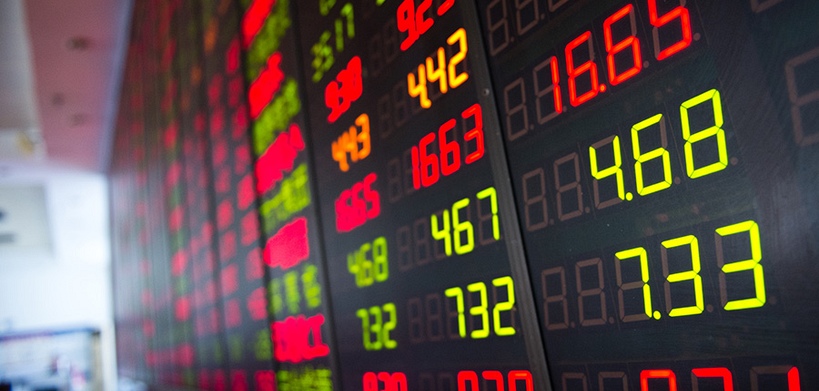
- 2,476 is the Kospi Composite Index's highest rate in 3 weeks.
- Bollinger analysis indicates upper Band® is at 2,483.18
While the Kospi Composite Index is on a 3 day uptrend Yesterday's session put the brakes on the ongoing uptrend — the Kospi Composite Index recovered back to 2,474.53 after dipping down to 2,474, in a session that followed Friday's 2,472.34 close value.
The past 3 months have been positive for the Kospi Composite Index as it added 11.49% compared to its 3-month low of 2,155.49.
With regards to technical trend indicators, chart analysis show that the MACD index is indicating that momentum is shifting from bearish to bullish following a positive crossover. When the MACD rises above the signal line, it is typically considered to be a bullish development favoring long positions. According to asset volatility analysis, the Kospi Composite Index's upper Bollinger Band® is at 2,483.18, suggesting that a downward move may follow. A study of the Kospi Composite Index's historical price actions shows the Kospi Composite Index is approaching key support, around 7.54 points away from 2,467. Dipping below could indicate further losses are ahead while a failure to break below this level is likely to be seen positively by market bulls.
Notwithstanding the Kospi Composite Index's appreciation in recent days, the technical outlook suggests its bullish run is now fading.
Fundamental indicators – South Korea CPI (YoY) (Mar) released yesterday at 23:00 UTC with a figure of 4.2, while the previous figure was 4.8.
While the Kospi Composite Index was pretty flat yesterday, mixed performances were seen elsewhere as Dow Jones added 0.98% and closed around 33,274 yesterday. FTSE moves up 0.54% yesterday and closed at 7,631.74. CAC went up by 0.32% yesterday, and closed at 7,346.

 |
|  April 04, 2023


